DISK SCHEDULING
Experiment Number 3 : SCAN
To view Simulator, Click Here
Software
System Requirements : Chrome Web Browser
Windows :
Download jar file from the link provided above and run it directly.
Linux :
Command line to download Chrome Web Browser :
sudo apt-get install chromium-browser
Command line to run jar file :
java -jar (filename).jar
Steps to use Simulator :
Step 1 : Click on the link
given above to go to Simulator Page. A new tab opens. The Simulator window looks like the image given below :

Step 2 : From this window,
user can select the Algorithm , the Direction of Read/Write head, can enter the Sequence of
cylinders, the Initial cylinder and the Final cylinder (for SCAN and CSCAN only). There
are 3 buttons after these options. They are Plot , Compare and Go to Theory Page. Their
use is explained with the example given below.

Step 3 : Consider the example
given below :
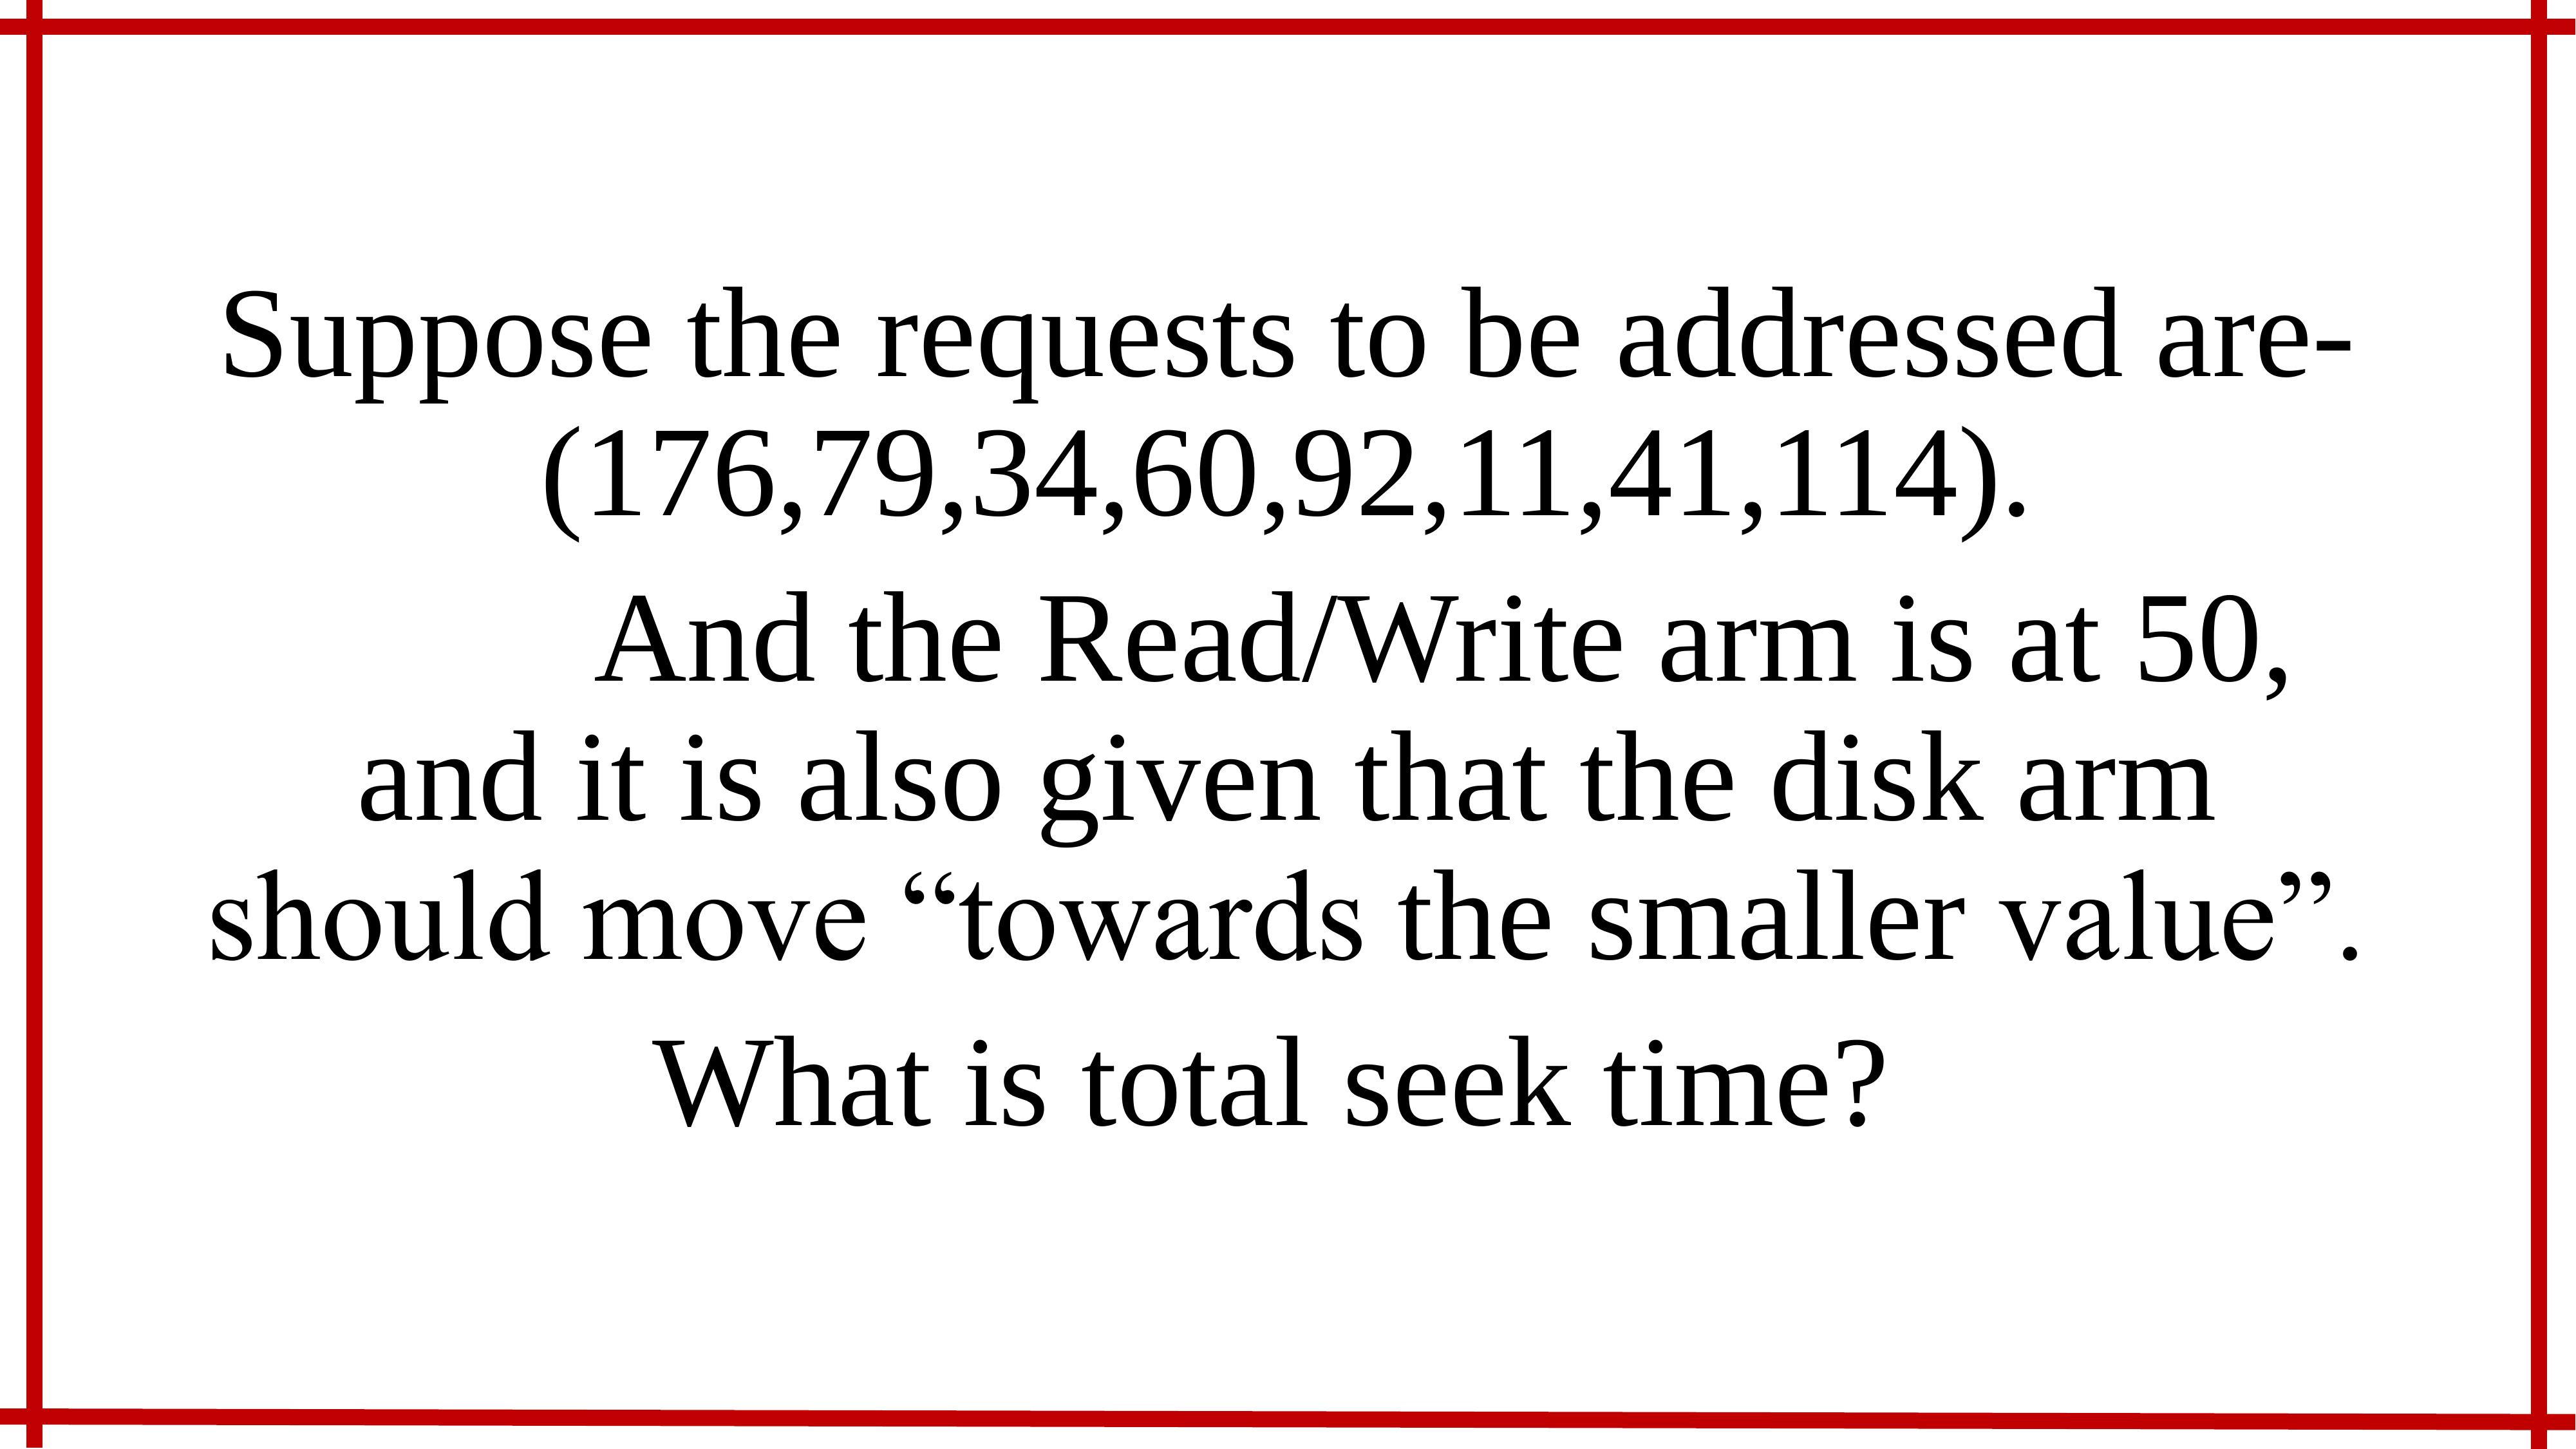
Step 4 : From the question, we
understand that the given data is the sequence of cylinders and the initial cylinder value is given. On the
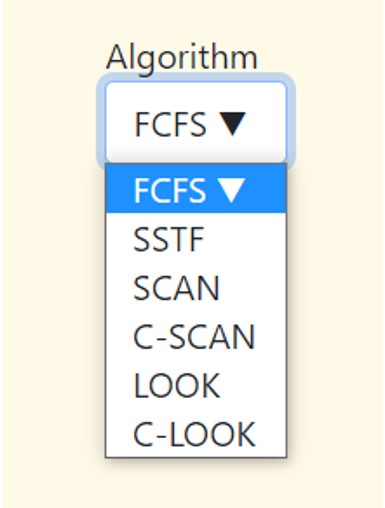
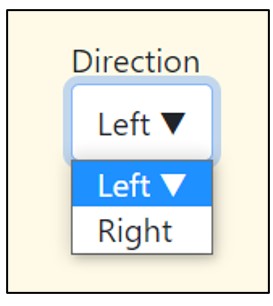
simulator page we select the algorithm as SCAN from the dropdown and direction is set to left. Enter the
sequence without any comma or full stop. Enter only numbers separated by spaces.

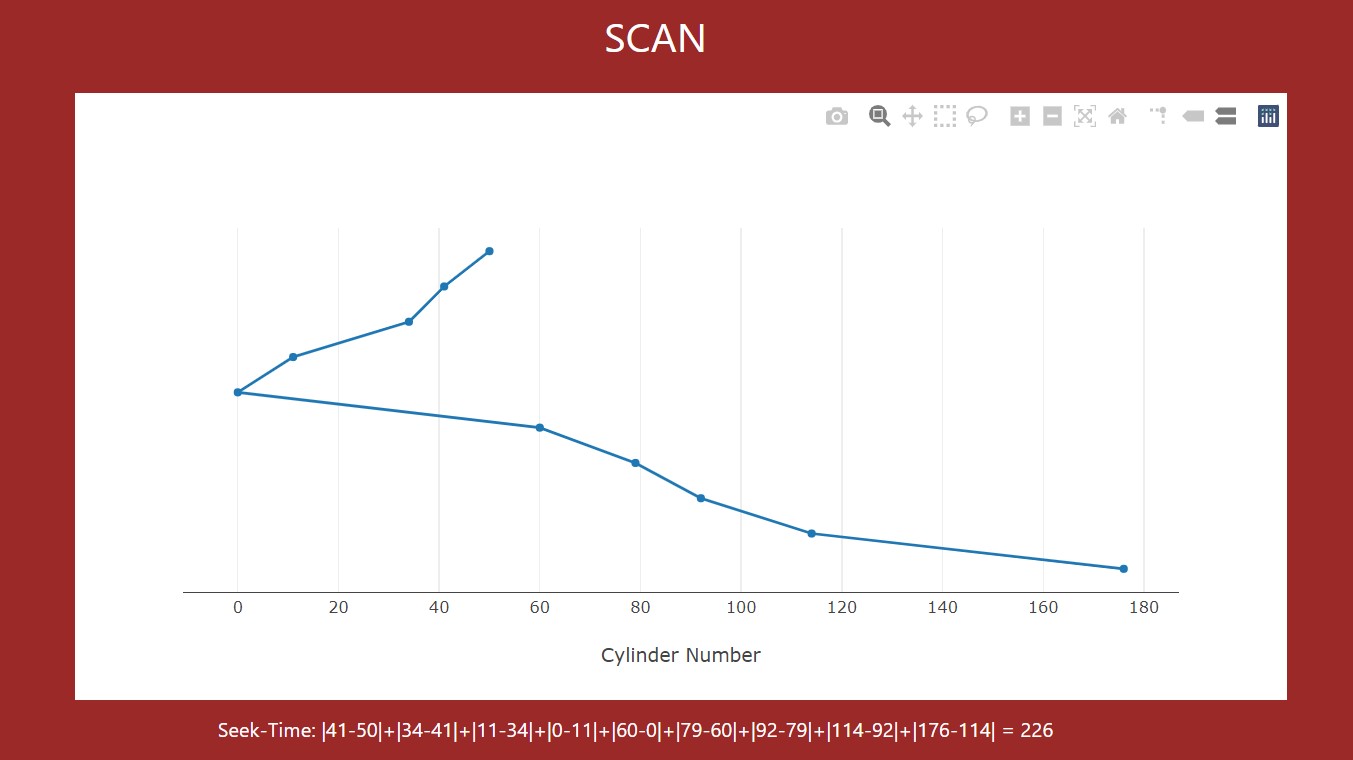
Step 5 : Now press Plot
button to get the graph. Seek time is calculated and displayed below it. On hovering the values are showed
respectively. Answer is displayed like the image given below :
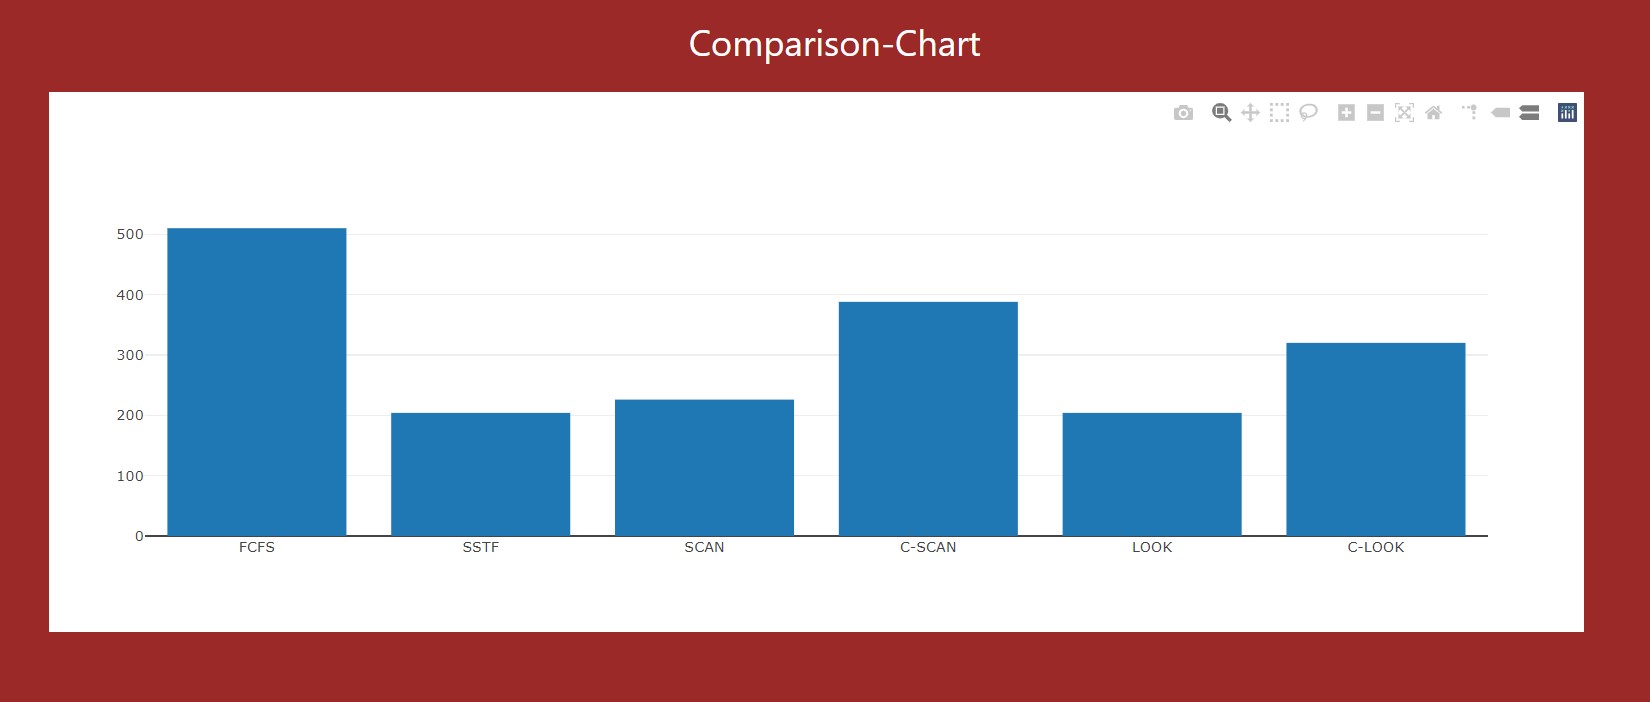
Step 6 : The Compare
button compares the same question with different algorithm with their respective seek time. It is plotted as a
bar graph shown below this line graph. On hovering the values are showed respectively.
There are other options in the graph which is plotted and its uses are given below.
The icons seen in the simulation above graphs are of great use. Following are its properties:
Camera icon :  To download image in png format .
Magnifying glass :  To magnify a selected area.
Pan :  To move the graph in any direction.
Box Select :  To select a region in rectangular or square
format.
Lasso Select :  To select a region in any manner.
‘+’ sign :  Zoom In .
‘-’ sign :  Zoom Out .
Auto scale & Reset Axes :  To bring the graph to original size and axes
if zoomed in/out.
Toggle Spike Line :  Show the intersection point and value of
points on the graph.
Show closest data on hover :  'X’ & ‘Y’ coordinates will be displayed in a
single box.
Compare data on hover :  ‘X’ & ‘Y’ coordinates will be displayed in
two different boxes & compared.
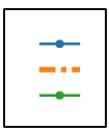 Upon clicking on the types of line in graph :
Single Click will make that line invisible.
Double Click on those line will display the lines in graph.
The Go to Theory Page button takes
the user back to the theory.

The icons seen in the simulation above graphs are of great use. Following are its properties:
 To download image in png format .
  To magnify a selected area.
  To move the graph in any direction.
  To select a region in rectangular or square
format.
  To select a region in any manner.
  Zoom In .
  Zoom Out .
  To bring the graph to original size and axes
if zoomed in/out.
  Show the intersection point and value of
points on the graph.
  'X’ & ‘Y’ coordinates will be displayed in a
single box.
 ‘X’ & ‘Y’ coordinates will be displayed in
two different boxes & compared.
  Upon clicking on the types of line in graph :
 Single Click will make that line invisible.
Double Click on those line will display the lines in graph.